

Is dat(a) new Data report?
Exciting news for those on our SEO package, we have designed a brand new Data Report that will be used in our monthly emails to clients.
As Google makes the move from UA to GA4, naturally, we had to adapt our reports. So, we thought why not design a brand spanking new Data Report at the same time. Our new report has a tons more information than the previous report, featuring multiple pages of useful data on how your website is performing, where improvements could be made, and useful insights into your audience.
This new report was a joint project between our developers and our designers to enhance the amount of information that we provide clients, enabling them to make more informed choices about how to brand their websites and how to market themselves to a wider audience.
Itching to know what’s new? Well, let’s go over Yellow Cherry’s own report and see what it could look like for you.
Overview
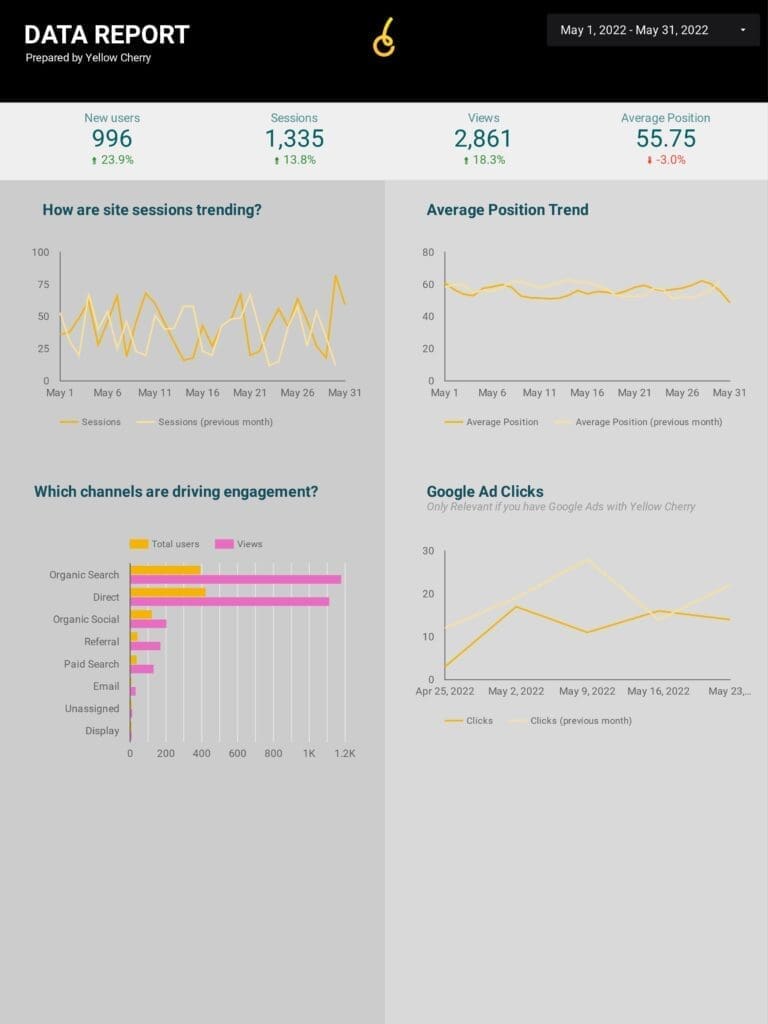
Here we can see the front page of the report. Showcasing an overview of all of the relevant stats so our clients can see how they are doing overall at a glance, without needing to dive deeper into the report. Sometimes, all you want is a quick look!
Geographic Data
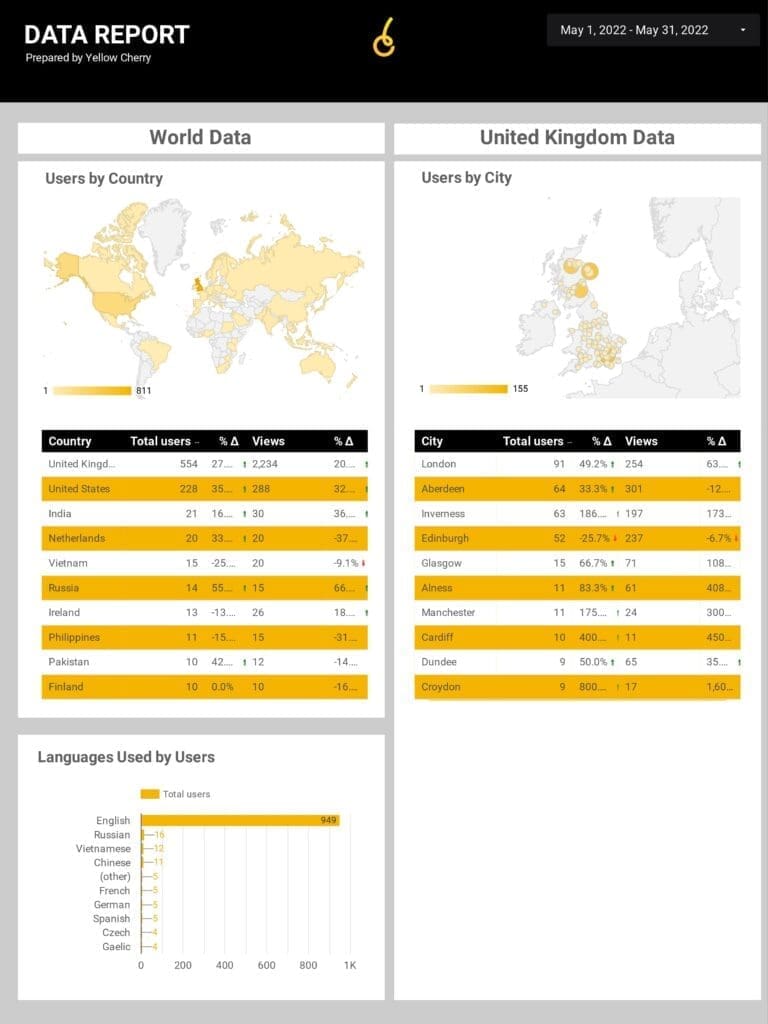
This page shows how your site performs not only within the UK, but worldwide! This could be the start of your business taking over the world, giving you information on where potential clients might be visiting your site. Or maybe a more localised look at the UK to see which city visits you the most is of more interest to you. Who doesn’t like checking out a good map!
Engaged Sessions
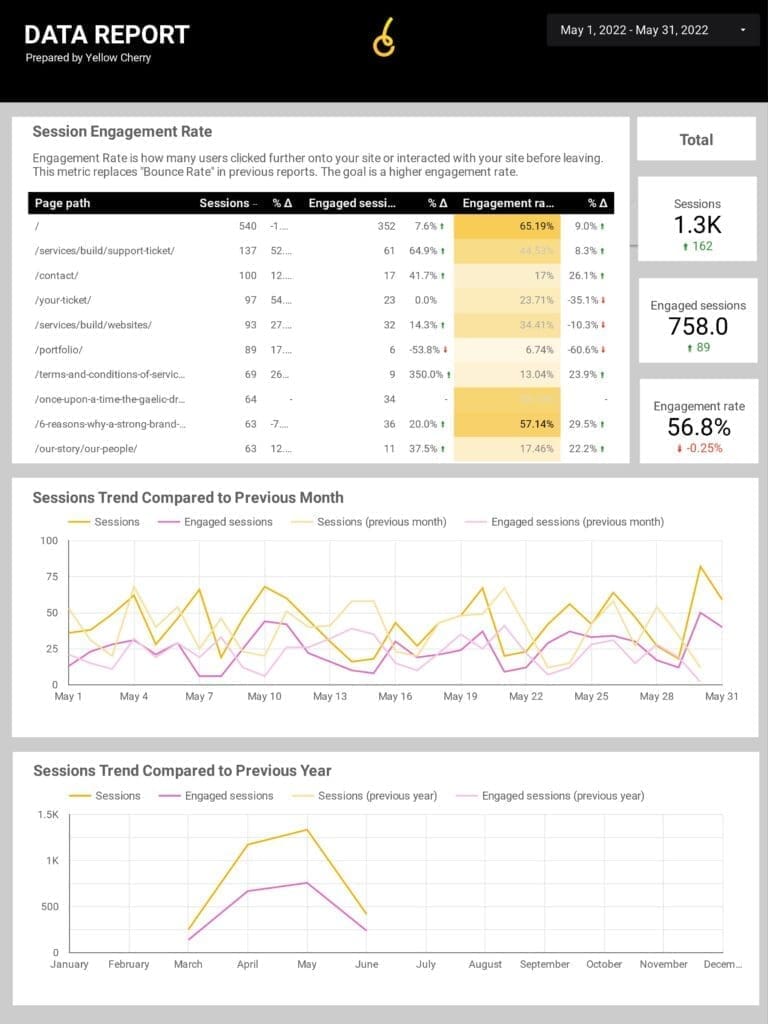
Lets dive into something a little more technical. This page shows “Sessions” and “Engaged Sessions” which are a new metric in Google Analytics. A session is when someone visits your site, but an engaged session is when someone visits your site and then interacts with it in some way. So instead of just leaving immediately, they go to a new page or fill out a form for example. This page shows which pages are doing well and which are not. Therefore giving an idea of which pages could use some improvements.
Audience Data
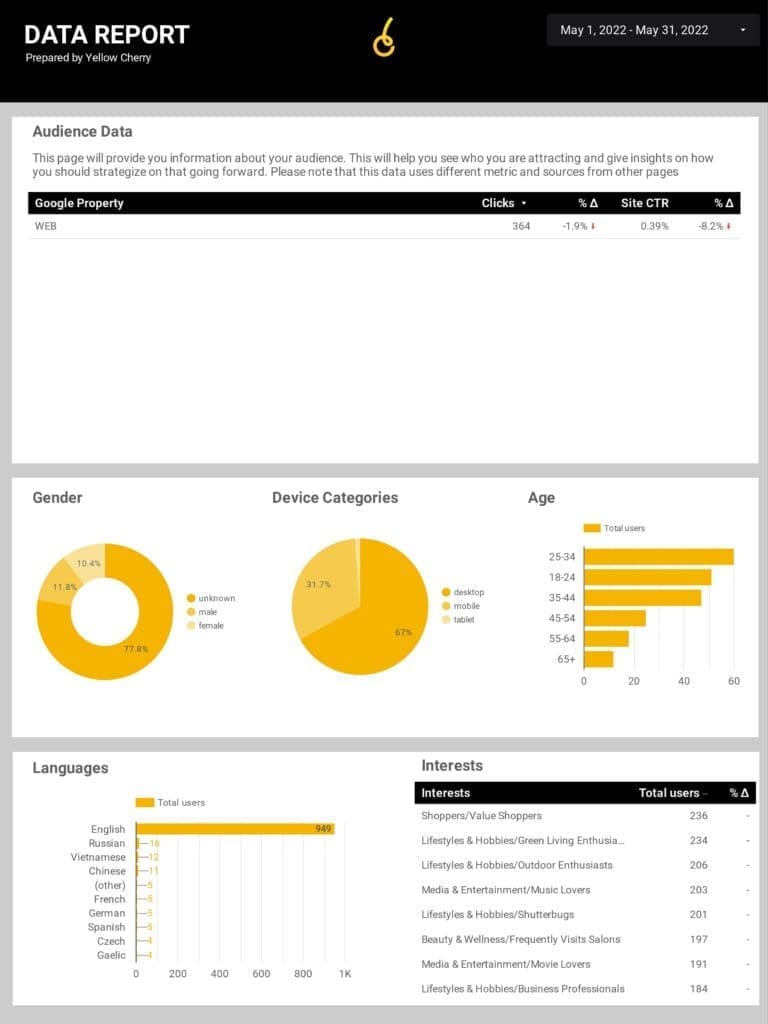
This page uses data from Google to build up an approximate representation of your audience. You can see things like the age and gender of your audience, even what kind of device they use. For example, we can see that Yellow Cherry has about an even numbers of male and female users, in the 25-34 age range and they mostly use desktops. Why do we want this information I hear you cry. Well, we could then use this information to design our website to make it appeal to that particular audience in order to boost our numbers. Alternatively, we could try targeting a different audience to further expand our market.
Google Ads
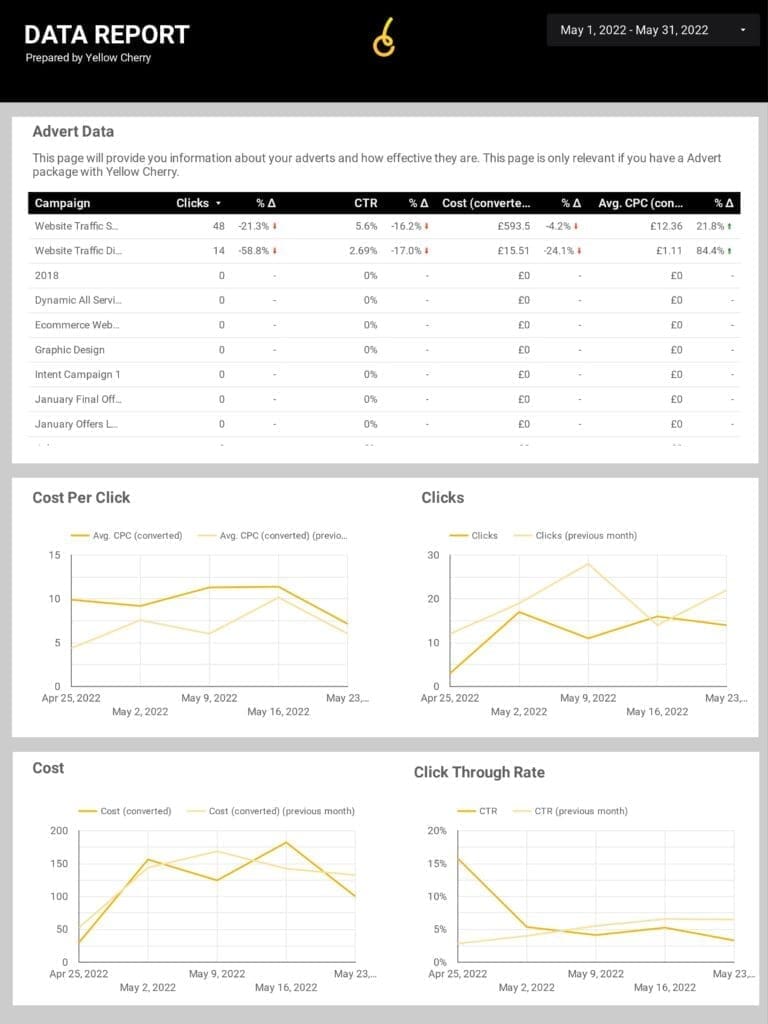
This page will only be included for clients that use Yellow Cherry to run their Google Ads campaigns. Here we show how effective campaigns are with a detailed table showing things like Cost Per Click, Click Through Rate and the cost of the campaign so far. The graphs at the bottom combine all of the campaigns to show how effective the adverts are in general.
Search Ranking
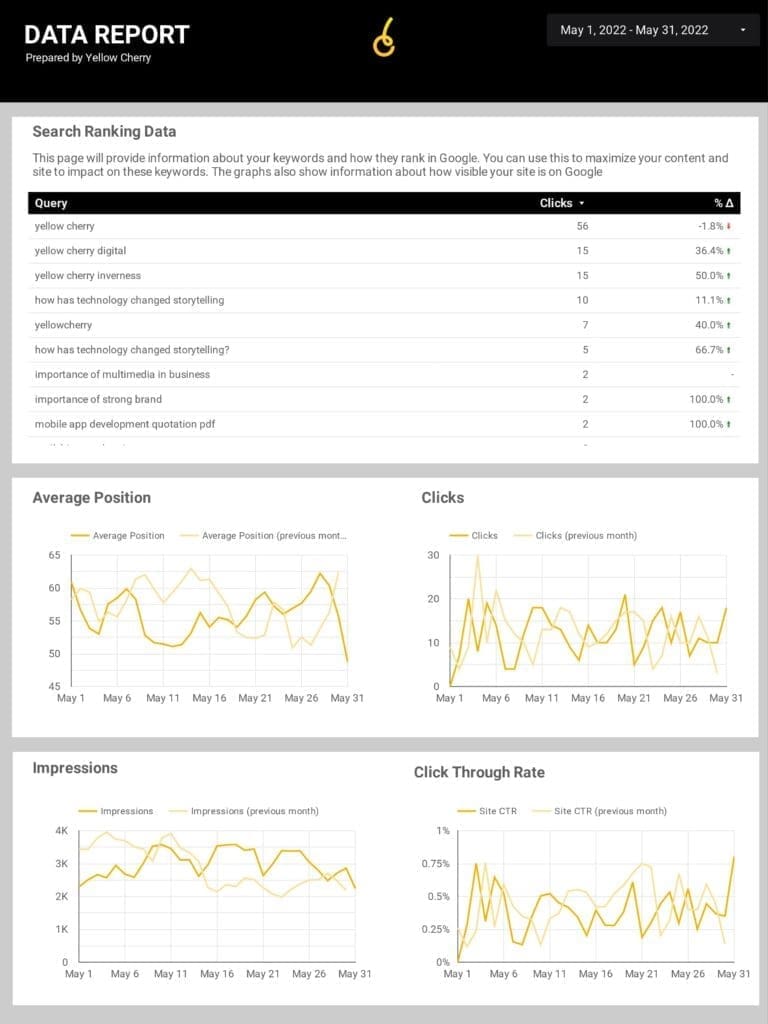
This page gets technical by using data from Google to show what people searched for when they saw your site. This shows how well your site is hitting the keywords. The graphs also show other data, like the average position of your site in Google search rankings, how many clicks the site gets and what is the Click Through Rate of your site. Pretty cool, right?
Conclusion
Just when you thought it couldn’t get better, your feedback is going to be invaluable in letting us create the perfect report. The example report above won’t be the final version, as we get feedback from our clients about what is useful and what is not, we will make the necessary adjustments to better serve each businesses specific needs.
All in all, we think our new report shows a lot of useful information that our clients can use to further enhance their business. Our reports are also very flexible and if a client requests a custom metric or graph, we can easily add or adapt the reports. A tailor made report, what more could you want?
If you love a good data report, then sign up for Yellow Cherry’s SEO service! Get in touch today to see what dat(a) can do for you.